plot(1:10, 1:10, main = "My Plot", xlab
     = "X-axis", ylab = "Y-axis")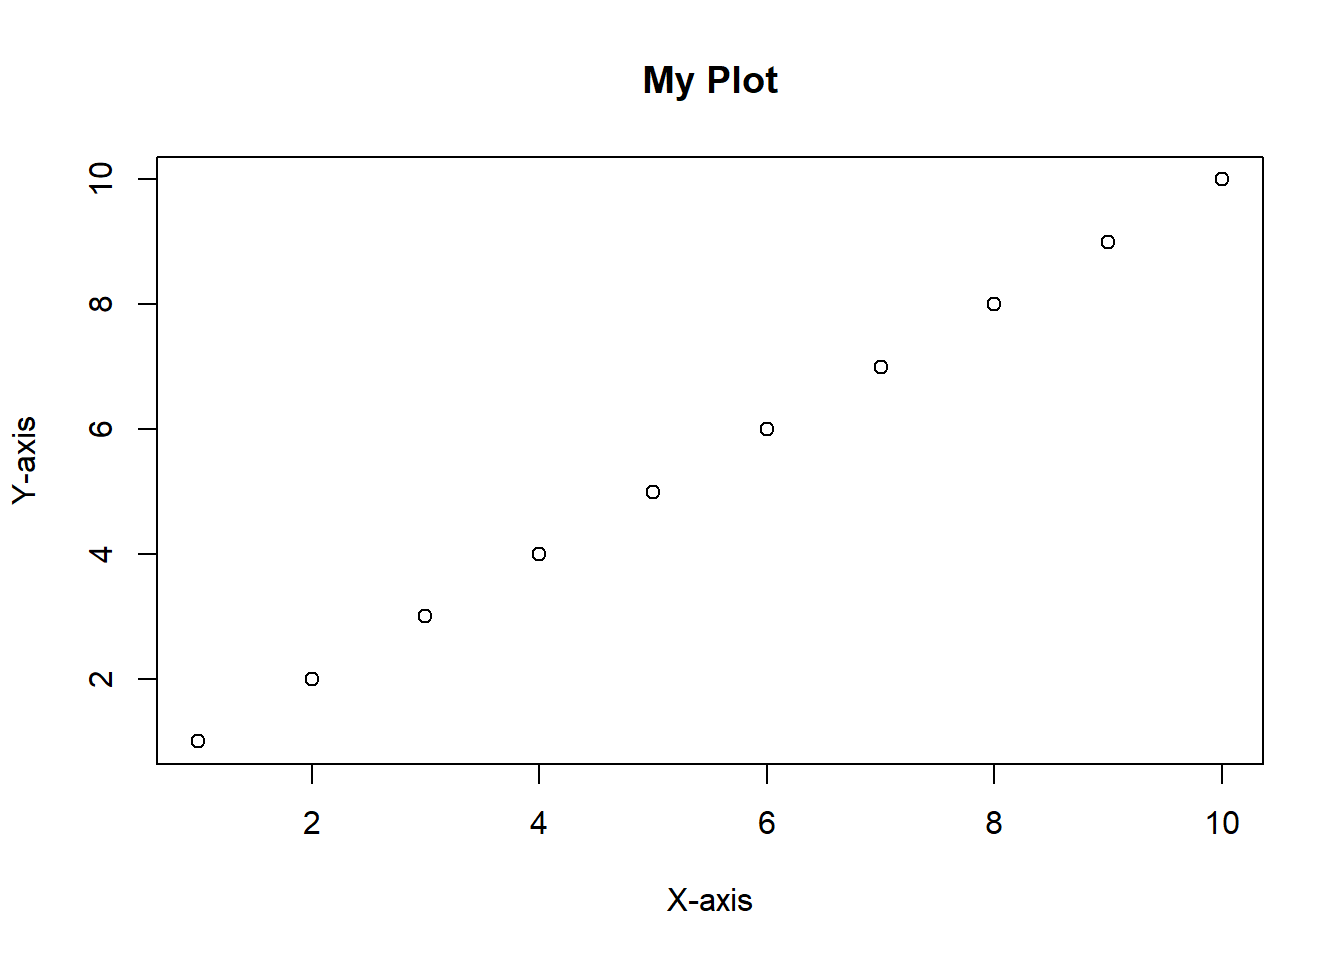
Once you have created a plot in R, you may want to save it for future use or to include it in a report or presentation. R provides several functions to save plots in different formats, such as PNG, JPEG, PDF, and SVG. Let’s create a simple plot and save it as PNG (image) and PDF (vectorized) formats.
plot(1:10, 1:10, main = "My Plot", xlab
= "X-axis", ylab = "Y-axis")
To save a plot as a PNG file, you can use the png() function to specify the file name and dimensions, followed by the plotting commands, and then use the dev.off() function to close the device and save the file. Here’s an example:
# Create a PNG file
png("my_plot.png", width = 800, height = 600)
# Create a simple plot
plot(1:10, 1:10, main = "My Plot", xlab
     = "X-axis", ylab = "Y-axis")
# Close the device
dev.off()
To save a plot as a PDF file, you can use the pdf() function in a similar way:
pdf("my_plot.pdf", width = 8, height = 6)

plot(1:10, 1:10, main = "My Plot", xlab
     = "X-axis", ylab = "Y-axis")
# Always close the device
dev.off()
These commands will create two files, my_plot.png and my_plot.pdf, in your working directory. You can adjust the width and height parameters to change the size of the saved plots as needed.